
This blog post is based on an interview conducted with a voice network engineer at one of our long-time clients.
7:30 AM – My office
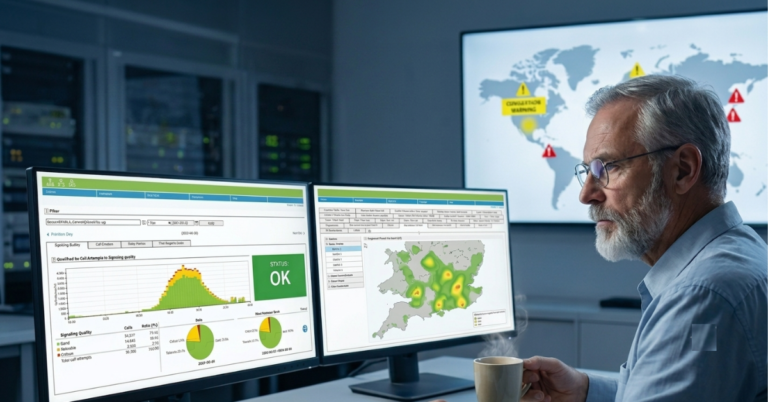
The morning routine hasn’t changed in years, and honestly, I hope it never does. Coffee first, then straight to my workstation where my monitors display the heartbeat of our fixed-line infrastructure. As the senior engineer responsible for our entire fixed-line network, my day begins the same way every morning: “coffee with the system,” as I like to call it.
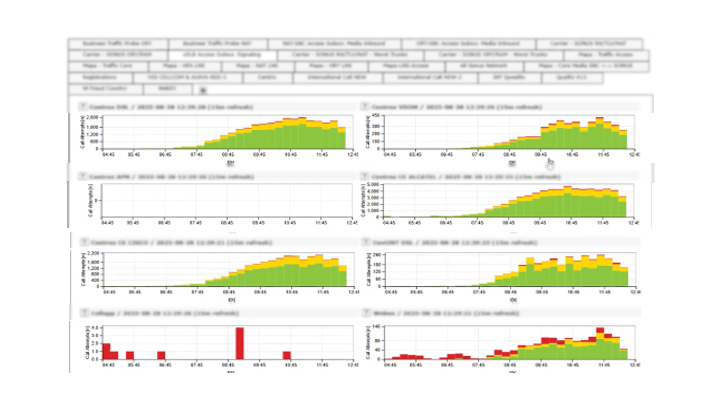
I pull up the dashboard I built when we started using Qrystal – a single screen that tells me everything I need to know about our network’s health. Voice quality metrics cascade across the display in familiar patterns. Green indicators show normal operations across our DSL infrastructure. The Alcatel systems are humming along nicely. Cisco equipment showing standard performance. The concurrent call volume graph displays the gentle morning rise as the country wakes up and starts making calls.
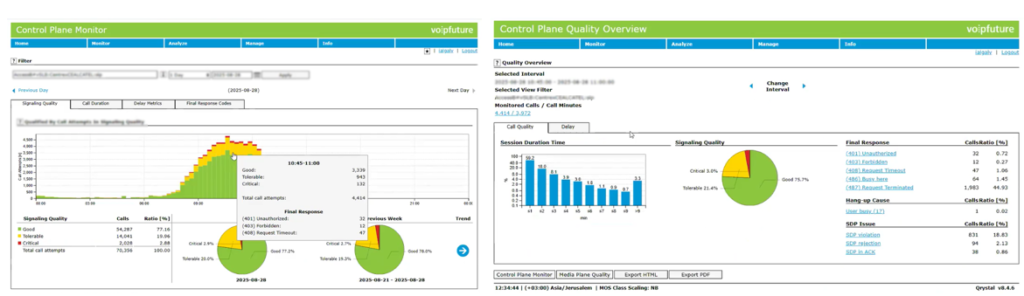
This isn’t just data visualization – it’s my network’s vital signs. After over a decade in telecom, I can spot anomalies before most systems even register them. Today looks clean. No red flags, no concerning trends. Just the steady, predictable pulse of millions of conversations flowing through fiber optic cables and switching systems.
But I know from experience that this calm can change in seconds.
8:45 AM – First conversation with customer support team
The conversation starts with this question pointed at me: “We had some complaints yesterday about call quality in the northern regions. Anything showing up in your monitoring?”
I drill down into the regional view with a few clicks. The beauty of our current monitoring system is this granular visibility. I can move from a country-wide overview to individual customer calls in seconds. “Let me check… northern region DSL infrastructure shows a slight uptick in packet loss yesterday evening between 6-8 PM. Probably network congestion during peak hours. I’ll flag it for capacity review.”
This kind of proactive analysis wasn’t possible with our old tools. We sometimes learned about issues only after customer complaints piled up. Now we can spot problems and often resolve them before customers even notice.
10:15 AM – The morning drill-down
Back at my desk, I dive deeper into the network data. This is where the real detective work happens. Qrystal allows me to examine voice quality metrics across different infrastructure types: DSL, Alcatel, VDOM, Cisco. Each technology has its own behavioral patterns and potential failure points.
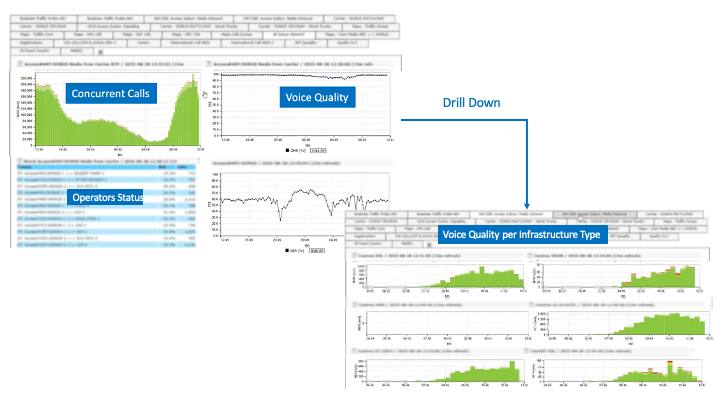
I navigate through the drill-down interface, moving from network-wide statistics to infrastructure level, IP address level, then down to individual call level. The system tracks everything: call setup success rates, dropped call percentages, voice quality scores, and dozens of other key performance indicators.
One aspect that I’m particularly interested in is our international traffic patterns. We interconnect with dozens of international carriers, and each relationship requires careful monitoring. Fraud attempts are constant in our industry – sophisticated operations that can cost millions if not detected quickly.
I examine the international operator dashboard I designed. Traffic volumes to various countries displayed in real-time graphs. Most patterns look normal, but I notice an unusual spike in calls to a specific destination. The pattern is subtle – not dramatic enough to trigger automatic alarms, but inconsistent with historical trends.
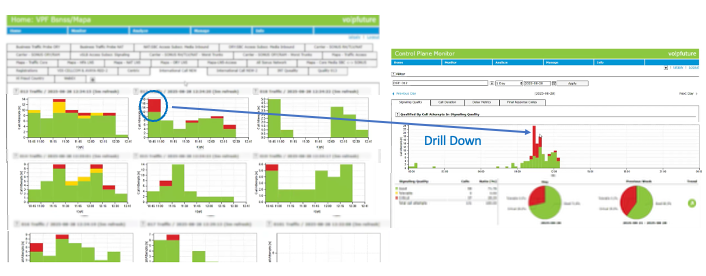
This requires investigation.
11:30 AM – Fraud investigation
I pull up the detailed call analysis interface and filter for calls to the suspicious destination. The data reveals a concerning pattern: multiple calls from different customer numbers, all lasting exactly the same duration, all terminating with identical response codes. Classic fraud indicators.
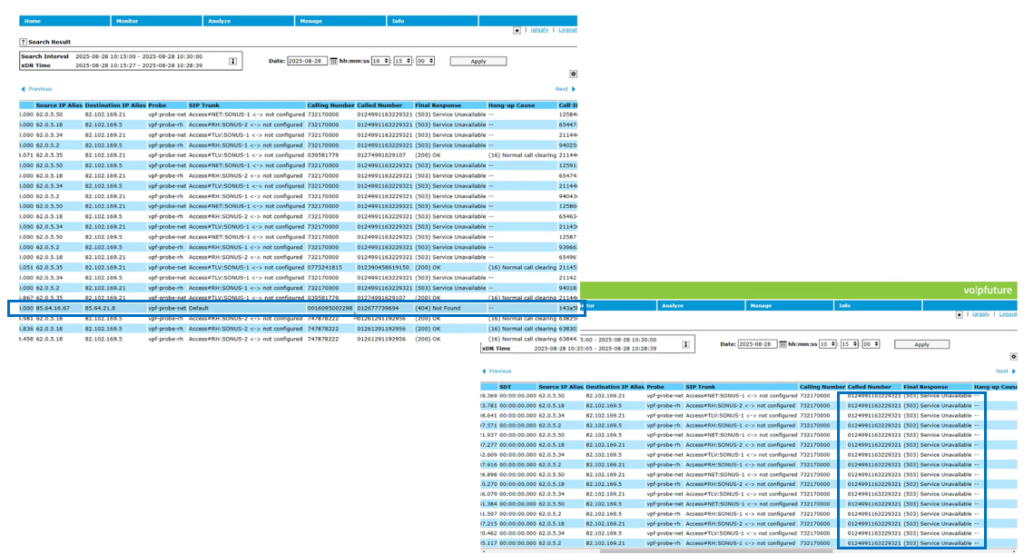
Traditional fraud detection systems rely on Call Detail Records (CDRs) that are processed hours after calls complete. By the time these systems identify problems, fraudsters have already stolen thousands of dollars’ worth of services. Our current monitoring analyzes traffic in real-time, allowing us to spot and stop fraud within 15-20 minutes instead of 2-5 hours.
I dig deeper into the calling patterns. The interface shows me that most fraudulent calls are coming from accounts with fake caller ID information – another red flag. I can see the exact IP addresses, the signaling patterns, even the network path these calls are taking through our infrastructure.
Time to alert our fraud prevention team and block these accounts before more damage occurs. I create an incident ticket with all the technical evidence attached. Thanks to the granular visibility our monitoring provides, I can give the fraud team everything they need to take immediate.
12:30 PM – Lunch break and reflection
Grabbing lunch in the cafeteria, I reflect on how dramatically our operations have evolved. Three years ago, when we implemented Qrystal, I was skeptical about yet another “revolutionary” network tool. We’d been burned before by systems that promised comprehensive visibility but delivered only basic graphs and delayed alerts.
Just recently we had another incident that made the difference clear yet again. Twenty thousand customers suddenly lost service – the kind of crisis that sends executives into panic mode and generates emergency conference calls with C-level executives demanding answers.
With our old monitoring setup, this investigation would have taken hours. Teams would scramble to check individual network elements, examine server logs, and coordinate across multiple departments. Customer service would field thousands of angry calls while engineering worked frantically to isolate the problem.
Instead, I was able to identify the root cause literally in four mouse clicks. Qrystal immediately highlighted the problem: a failed network interface card in one of our facilities, specifically on Alcatel infrastructure serving that region. The drill-down capability led me directly to the faulty hardware. No guesswork, no time wasted checking unrelated systems.
The speed of resolution amazed everyone, excluding myself. What typically required hours of cross-team coordination took minutes of focused analysis.
1:45 PM – Revenue optimization analysis
The afternoon brings a different type of challenge: revenue optimization. As a technical engineer, I don’t usually think about business metrics, but Qrystal has revealed opportunities to improve our financial performance through better network management.
I examine our international routing dashboard, which tracks call quality metrics across all our carrier interconnections: Success Rate (SER), Network Effectiveness Ratio (NER), Call Completion Rate (CCR), and several others. Each metric tells a story about our relationships with international partners.
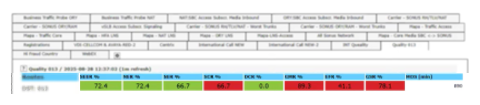
When call quality degrades on specific routes, customers experience poor service and may choose competitors for future international calls. Our monitoring helps identify these problems before they impact customer satisfaction. I can see which international destinations are performing below acceptable thresholds and alert our team to renegotiate agreements or find alternative carriers.
Today’s analysis reveals that one of our major European routes has been experiencing increased dropped call rates over the past week. The pattern suggests a problem with our carrier partner’s infrastructure rather than our own equipment. I document the issue and schedule a technical call with their engineering team.
This proactive approach to quality management has measurable business impact. When we maintain superior international call quality, customers stay with our service instead of switching to competitors.
3:20 PM – Cross-department collaboration
Qrystal has become integral to multiple departments across the organization. Business customer support uses the dashboards to quickly diagnose enterprise client issues. Residential customer service can drill down to individual customer problems and provide specific technical explanations rather than generic troubleshooting scripts. The operations team relies on our monitoring for capacity planning and network optimization.
I spend the afternoon training two junior engineers on advanced features of the monitoring system. The drill-down capabilities, custom dashboard creation, and trend analysis tools require hands-on experience to master effectively.
“The key,” I explain to them, “is understanding that every graph tells a story. These aren’t just pretty visualizations – they’re diagnostic tools that can guide you directly to problems. Learn to read the patterns, and you’ll be able to troubleshoot issues other engineers might miss entirely.”
4:30 PM – Planning for the future
Our success with fixed-line monitoring has generated interest in expanding the platform to our mobile network infrastructure. Mobile networks present different challenges: more complex signaling protocols, diverse device types, and rapidly evolving technologies. As we transition from 2G and 3G networks to 4G and 5G infrastructure, comprehensive monitoring becomes even more critical.
The volume of data generated by modern mobile networks is staggering. Without sophisticated analysis tools, engineers drown in information without gaining actionable insights. Qrystal’s strength lies in presenting complex data in intuitive, actionable formats.
5:45 PM – End of day
Before logging off, I review the day’s network performance statistics. Call quality remained stable across all infrastructure types. The fraud investigation resulted in blocking twelve accounts and preventing an estimated $15,000 in revenue loss. The international routing issue was escalated to our carrier partner and should be resolved tomorrow.
I update my custom dashboard with a few new widgets focused on the metrics that proved most valuable today. The beauty of Qrystal is this flexibility – I can continuously adapt the interface to highlight the most relevant information for current network conditions.
Tomorrow will bring new challenges. Maybe a major network upgrade that requires careful monitoring during the migration. Perhaps a sophisticated fraud attack that tests our detection capabilities. Or possibly a capacity issue as call volumes continue growing with our expanding customer base.
Whatever challenges arise, I’m confident in our ability to detect, analyze, and resolve them quickly. The comprehensive network visibility we’ve achieved transforms reactive fire-fighting into proactive network management.
As I shut down my workstation, I glance once more at the network status display. All green indicators, steady traffic patterns, normal voice quality metrics. The network that serves millions of customers is healthy and stable.
The commute home gives me time to appreciate how technology has evolved our industry. Twenty years ago, network monitoring meant physically visiting equipment rooms and manually checking hardware status lights. Today, I can diagnose complex problems from anywhere with internet connectivity, drilling down from country-wide overviews to individual customer experiences.
The human element remains crucial, though. Technology provides the tools, but experienced engineers must interpret the data, understand the implications, and make informed decisions. The most sophisticated monitoring system is only as effective as the people using it.
Tomorrow morning, I’ll start again with coffee and the system, ready to keep millions of conversations flowing smoothly across the infrastructure I’ve dedicated my career to maintaining and improving.