
Your finance team scrutinizes every capital expenditure line item. When 5G infrastructure demands hundreds of millions in investment, justifying another software licensing cost for voice monitoring becomes a boardroom battle you’d rather avoid.
Traditional perpetual software licenses consume CapEx budgets that operators need for physical infrastructure. A comprehensive monitoring platform typically requires substantial upfront payment for software licenses, plus annual maintenance fees.
The procurement process compounds the problem. RFIs, RFPs, RFQs, lengthy vendor negotiations, budget approval cycles, and depreciation schedules can mean years pass between identifying the monitoring need and deploying the solution. Meanwhile, VoLTE quality issues affect subscriber experience, wholesale partners complain about interconnect performance, and your NOC team is virtually blind.
Let’s cut it to the chase. Packet-switched voice services require completely different monitoring approaches, yet finance teams see only another capital request competing with radio access network modernization and spectrum acquisition costs.
No doubt that budget constraints drive platform selection, but operational capabilities determine long-term value. Getting past the CapEx barrier opens the door. What happens next depends entirely on whether your monitoring platform delivers the technical capabilities that actually matter: dual visibility into both control and media planes, temporal resolution that captures quality fluctuations, and automatic root cause detection that accelerates troubleshooting.
Why Monitoring Only SIP Signaling Leaves You Flying Blind
SIP monitoring tells you whether calls connect. RTP monitoring reveals what subscribers actually hear. Most operators monitor the control plane extensively while barely touching the media plane, creating a visibility gap that manifests as customer complaints rather than proactive network management.
Session Initiation Protocol packets account for roughly 2% of VoIP bandwidth. Your existing tools likely capture call setup time, post-dial delay, registration status, and hang-up causes. All valuable metrics. All insufficient for understanding in-call quality.
Real-time Transport Protocol carries the remaining 98% of voice traffic. When subscribers complain about choppy audio or one-way calls, the evidence lives in RTP packet streams. Signaling shows successful call establishment. Media plane analysis reveals that packets never arrived, carried only silence, or degraded below acceptable thresholds.
The 98% Problem: What RTP Reveals That SIP Can’t
Silent call scenario: SIP indicates normal setup, connection, and termination. RTP analysis reveals the actual problem: packets are transmitted but never received due to the TTL exceeding the hop count on an international route.
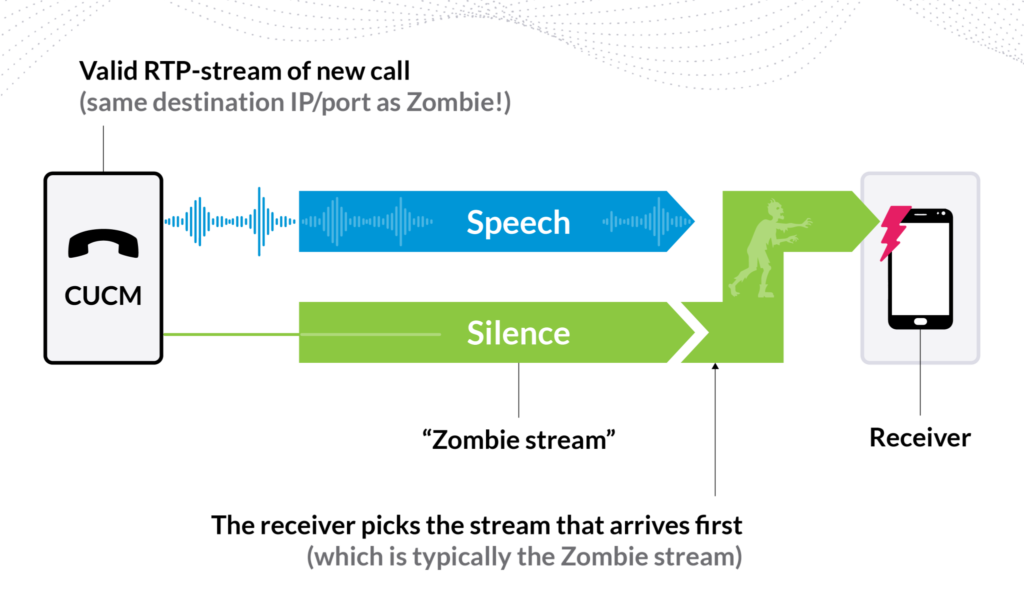
Zombie streams present another failure pattern. A bug continues transmitting RTP packets after call termination. When a new call uses the same destination, the receiver gets two streams and may select the silent zombie instead of legitimate media. Your SIP monitoring reports success. Subscribers report silence.
Network overload causes quality degradation that only media-plane monitoring detects. Periodic packet loss occurs when polling intervals interrupt voice processing on overloaded routers. Subscribers experience audio dropouts every 60 seconds. SIP KPIs remain perfect. RTP analysis shows the pattern immediately.
Codec mismatches mid-call trigger issues that control plane monitoring misses entirely. Packets arrive but can’t be decoded properly. SIP shows normal duration. RTP reveals the MOS collapse.
For interconnection disputes, RTP measurements at multiple points isolate exactly where packet loss occurs. Without dual visibility, troubleshooting becomes finger-pointing rather than data-driven resolution.
The MOS Problem Nobody Talks About
Mean Opinion Score gives you a single number for call quality. Unfortunately, that single number often lies about what subscribers actually experienced. Averaging MOS across an entire call hides the quality fluctuations that cause users to terminate calls early and switch carriers.
MOS originated from subjective testing. People rate audio quality on a 1-5 scale. Modern implementations use algorithms to estimate MOS from network measurements. Accuracy depends on the measurement methodology and how frequently you’re actually checking quality.
Why a Single MOS Value Can Hide Service Failures
A 10-minute call returns an average MOS of 3.8. Your SLA threshold sits at 3.6. The call qualifies as acceptable quality. Nobody examines the underlying data showing that MOS dropped to 1.5 for the final 30 seconds when severe packet loss rendered conversation impossible. The subscriber hung up frustrated, but your metrics show successful service delivery.
Direction matters for user experience. Party A hears excellent audio throughout the call with MOS consistently above 4.3. Party B experiences degraded quality, with a MOS around 3.2, due to packet loss on the return path. Averaging the two directions yields an acceptable 3.75 MOS. One subscriber had a poor experience that your average metric completely obscures.
Call length creates comparison problems. How do you evaluate whether a 30-second call with MOS 4.0 represents better or worse service than a 10-minute call with MOS 3.9? Aggregating quality metrics across calls of varying lengths without accounting for time intervals yields meaningless results.
How 5-Second Time-Slicing Reveals What’s Really Happening
Segmenting RTP streams into fixed-length time slices solves the temporal resolution problem. Each 5-second segment gets analyzed independently, producing a Quality Data Record with measurements including MOS, packet loss, jitter, and codec information for that specific interval.
Five-second resolution captures quality fluctuations that matter to subscribers. When packet loss spikes for 15 seconds mid-call, you see exactly which segments show degraded performance rather than watching that impairment disappear into an averaged metric. Network events directly correlate with quality impact because your measurement intervals align with the timescales of typical network issues.
Packet loss patterns become visible through time-sliced analysis. Losing every hundredth packet consistently produces a different quality impact than losing 100 consecutive packets in a single burst. Time-slicing distinguishes between random packet loss, burst loss, and loss density patterns. Each pattern indicates distinct root causes that require different fixes. Averaged metrics treat all packet loss identically despite their vastly different effects on user experience.
Industry standards support the time-slice approach for media plane monitoring, defining how to segment RTP streams, calculate per-segment metrics, and aggregate results into meaningful KPIs. This framework ensures consistent quality assessment across different monitoring solutions.
From Meaningless Averages to Actionable KPIs
Fixed-length time slices enable direct comparison regardless of call duration. Each Quality Data Record corresponds to the same 5-second interval, enabling legitimate statistical aggregation. You can now calculate the percentage of voice minutes meeting quality thresholds, identify temporal patterns in quality degradation, and correlate quality events with network changes.
Good Minute Ratio transforms MOS from a vague average into an actionable metric. GMR measures the percentage of 5-second intervals exceeding your defined quality threshold. A trunk route showing 92% GMR means 92% of voice minutes delivered at an acceptable quality, while 8% fell below the threshold and require investigation.
Temporal patterns emerge from time-sliced data. Network polling that interrupts voice processing results in periodic quality degradation every 60 seconds. Capacity issues manifest as quality collapse during business hours, which resolves in off-peak periods. Interconnect partner performance varies by time of day, revealing routing or capacity constraints. Single-averaged metrics hide these patterns completely.
Real Troubleshooting Speed: The 80% Difference
Time-to-fix determines how long subscribers experience poor service quality. Traditional troubleshooting starts with customer complaints, ticket escalation, and attempts to reproduce issues that often don’t recur during investigation. Days or weeks pass while waiting for additional clues. Comprehensive media plane monitoring reveals issues before customers complain, with alerts triggered when metrics cross thresholds.
Pattern matching algorithms analyze millions of RTP packets per second, identifying known impairment signatures automatically. Sender jitter, router CPU overload, and NAT problems each produce distinctive patterns. Automatic indicators tag calls exhibiting these failure patterns, giving engineers specific problem types rather than generic quality violations. Instead of analyzing packet traces from scratch, troubleshooting starts with high-probability root cause hypotheses.
Distributed probes at strategic network locations isolate failure domains immediately. When quality degrades between monitoring points, you’ve identified the problematic network segment. Interconnection disputes resolve with objective data at network boundaries. International routing issues that would require exhaustive router investigation get pinpointed to specific path segments.
Silent calls and one-way audio traditionally require days of investigation. Comprehensive RTP monitoring detects zombie streams, silent payloads, and missing RTP flows immediately. Pattern matching identifies which stream carries legitimate media versus silence. Media plane measurements show exactly where transmission fails. Engineering receives specific remediation guidance within hours rather than after extended troubleshooting cycles.
Getting Advanced Capabilities Without the Budget Battle
Eliminating software licensing costs removes the primary barrier to deploying comprehensive voice monitoring. The free license model reverses the risk profile. Deploy monitoring infrastructure across your network immediately. Prove operational value through faster troubleshooting, improved quality management, and reduced customer complaints. Scale monitoring points as traffic grows without requesting additional capital for software licenses. Budget certainty comes from operational expenditure rather than capital depreciation and annual maintenance fee negotiations.
The SLA-based model aligns vendor incentives with operational outcomes. Service level agreements define exactly what performance you receive, with monitoring platform availability, data processing latency, and support response times measured against contractual commitments. Software updates arrive continuously rather than through painful upgrade cycles, deploying new features, security patches, and standards compliance automatically without license renewal negotiations. When troubleshooting widespread quality issues affecting thousands of subscribers, guaranteed support response times ensure vendor engineering assistance within hours rather than days. Technical capabilities remain current as VoIP technology evolves, with SLA-based models maintaining platform alignment with emerging codecs, transport protocols, and network architectures instead of freezing features at the version you originally purchased.