
We’ve all experienced good and bad calls using VoIP. But just how good or bad were they? How do we accurately reflect user experience with a standardized metric and allow for direct comparison between the quality levels of different calls?
The most popular metric available today to assess call quality is the Mean Opinion Score (MOS).
What started as an empirical subjective measurement has evolved into something much more technical. Initially, people in a quiet room would listen to audio files and assign scores (1–5) based on the quality of the media they heard. After all, if we want to measure user experience, the best solution is to ask users! Averaging the scores from a large group of people (that’s the mean in MOS) generates a final MOS value to be assigned to the audio.
However, this process has obvious scalability issues. It is not practical for providers to constantly maintain test groups to rate call quality for customer experience management or Service Level Agreement (SLA) monitoring – not to mention the obvious privacy no-go when listening in to live calls.
Therefore, MOS is now typically calculated using an automated computer-based approach. Machines have replaced people, and call-quality monitoring tools try to accurately emulate what the human score for new audio would be. Simulating a process with built-in subjectivity is not easy, but that is how MOS is calculated now: algorithms attempting to replicate the human experience.
Factors affecting MOS
Many parameters affect call quality and therefore the Mean Opinion Score, including:
- Hardware
- Codec
- Bandwidth
- Jitter
- Latency
- Packet loss
However, there is more to the story behind each MOS value, for example, which part of a conversation it reflects:
- LQ (Listening Quality) – the quality of the call as perceived by the listening party
- CQ (Conversational Quality) – the quality of the call during a conversation
- TQ (Talking Quality) – the quality of the call as perceived by the talking party
Finally, the MOS story needs to consider the process used to produce the final value:
- S (Subjective) – MOS measured by an empirical study (average of a group of people assigning scores)
- O (Objective) – automated MOS calculation based on end-to-end quality measurements (truly objective output based only on measurements)
- E (Estimated) – MOS calculated using a network planning model; for example, the E-Model defined in ITU-T G.107 (designed to be an estimate of what the subjective results would be, based on objective measurements)
Each of these descriptors is defined by Recommendation P.800.1 from the ITU Telecommunication Standardization Sector (ITU-T), part of the International Telecommunications Union (ITU).
To properly assess call quality, you cannot quote an MOS value without also including the relevant indicators shown above. That means combining the three quality types (listening, conversational, or talking) and three processes (subjective, objective, or estimated), producing nine distinct MOS values:
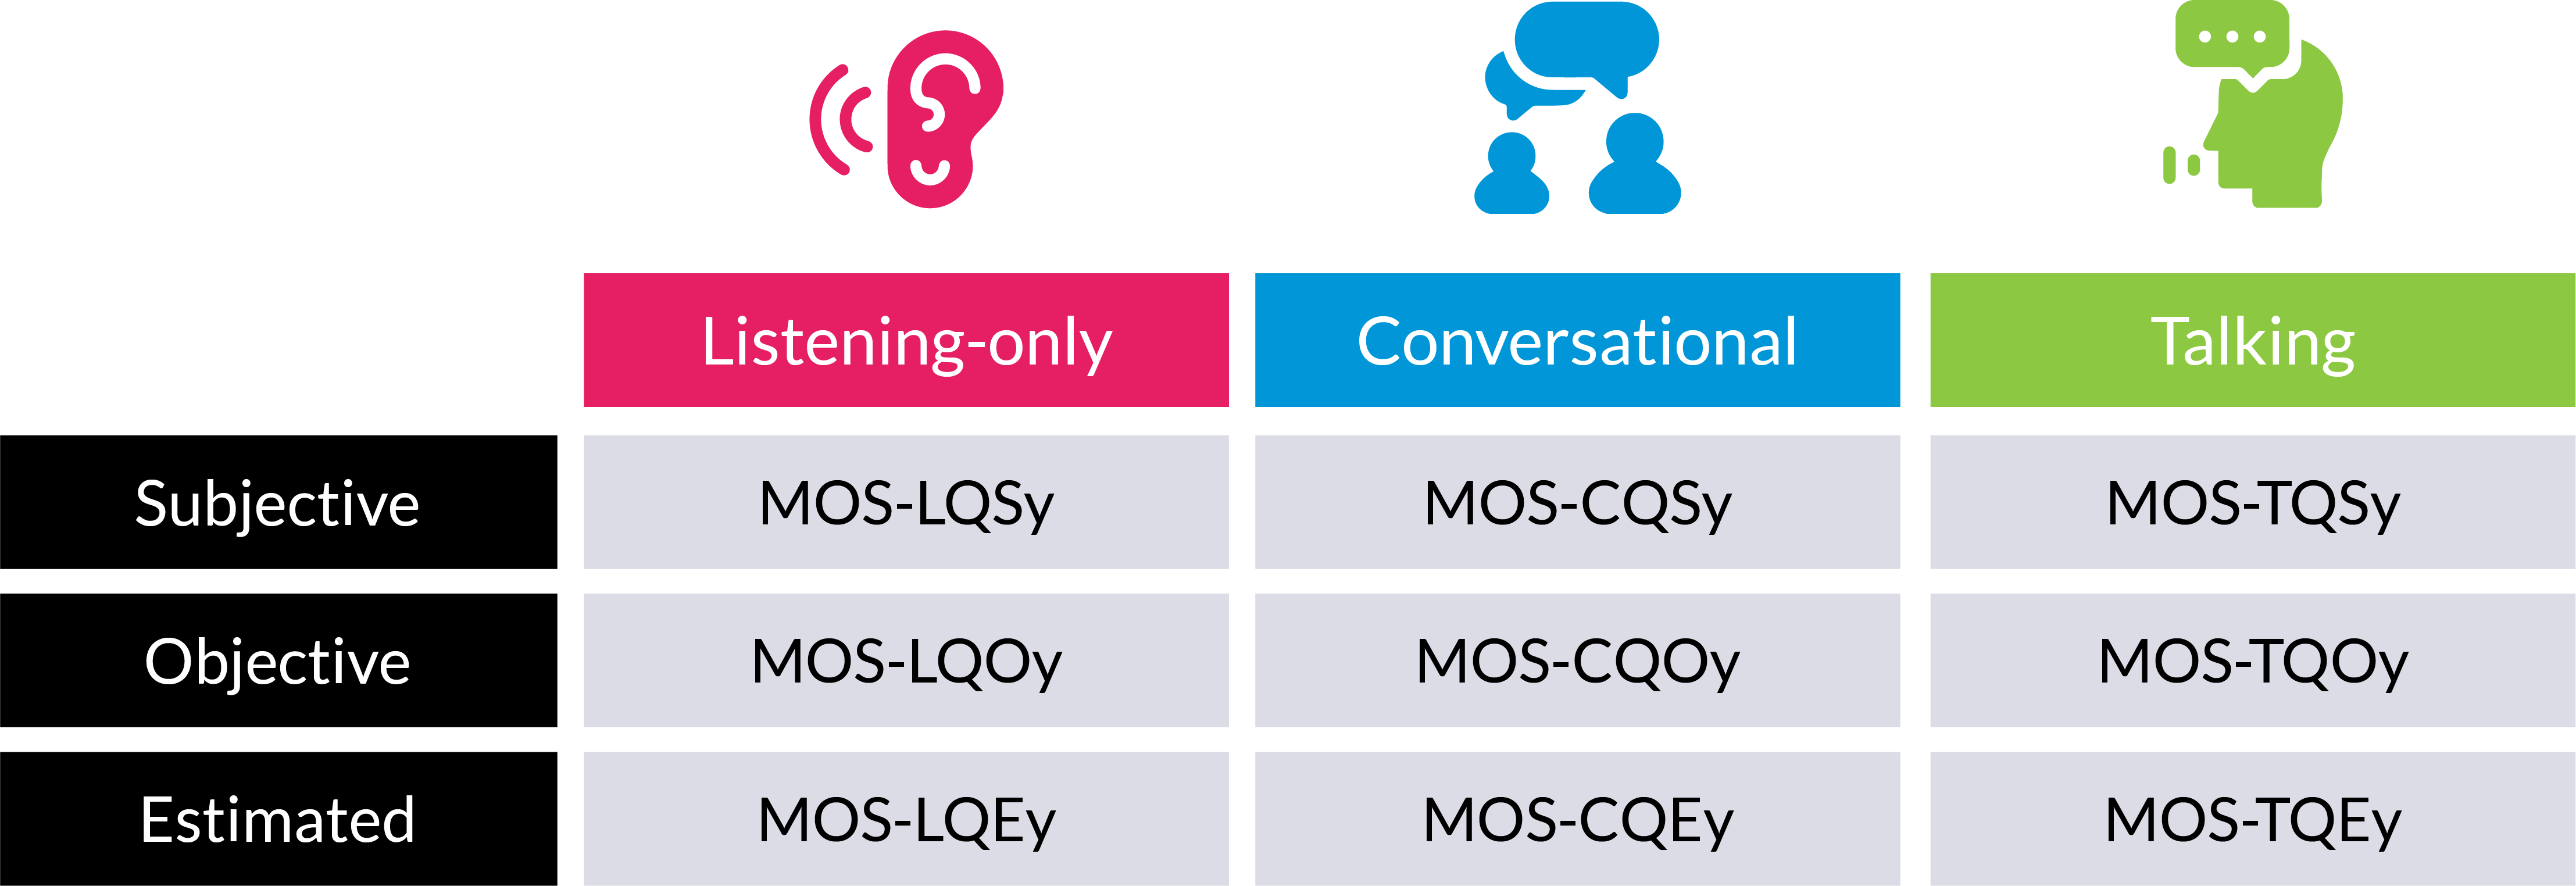
At the end of each acronym is a placeholder for an additional parameter needed in order to differentiate MOS values, representing the respective reference audio bandwidth. Typically, this can be narrowband (300-3400 Hz) denoted by “N,” or wideband (50-7000 Hz) represented by “W.” Very often, all these descriptors are omitted, and analysts must determine them from context.
The goal of MOS should always be to accurately reflect the end-user experience. However, MOS requires context, and even then, using a single number to represent overall call quality causes issues.
A single MOS value telling very different tales
Mean Opinion Scores can provide helpful information, and there are benefits to having a single indication of quality for reference. However, providers often apply MOS without fully considering its limitations. To be more specific, VoIP service metrics, like MOS, struggle to represent the quality of an entire call due to the following:
- Temporal information – packet loss has a significant effect on call quality, but a single average doesn’t show whether it occurs evenly throughout the call or in a condensed period, likely causing the call to be terminated
- Comparability – how do you compare the MOS of a 30-second call to the MOS of a 10-minute call? Unfortunately, there is no standard way of comparing VoIP quality metrics for calls of different lengths
- Aggregation – a single MOS value for calls of different lengths prevents aggregation and the use of advanced statistics and Key Performance Indicators (KPIs) for specific purposes. For example, you cannot give the same MOS value for a 30-second call that you would a 10-minute call. More on aggregation later
When it comes down to it, condensing an entire call and all the information it contains into a single quality metric will never accurately reflect the final user experience. Take, for example, the three scenarios shown below:
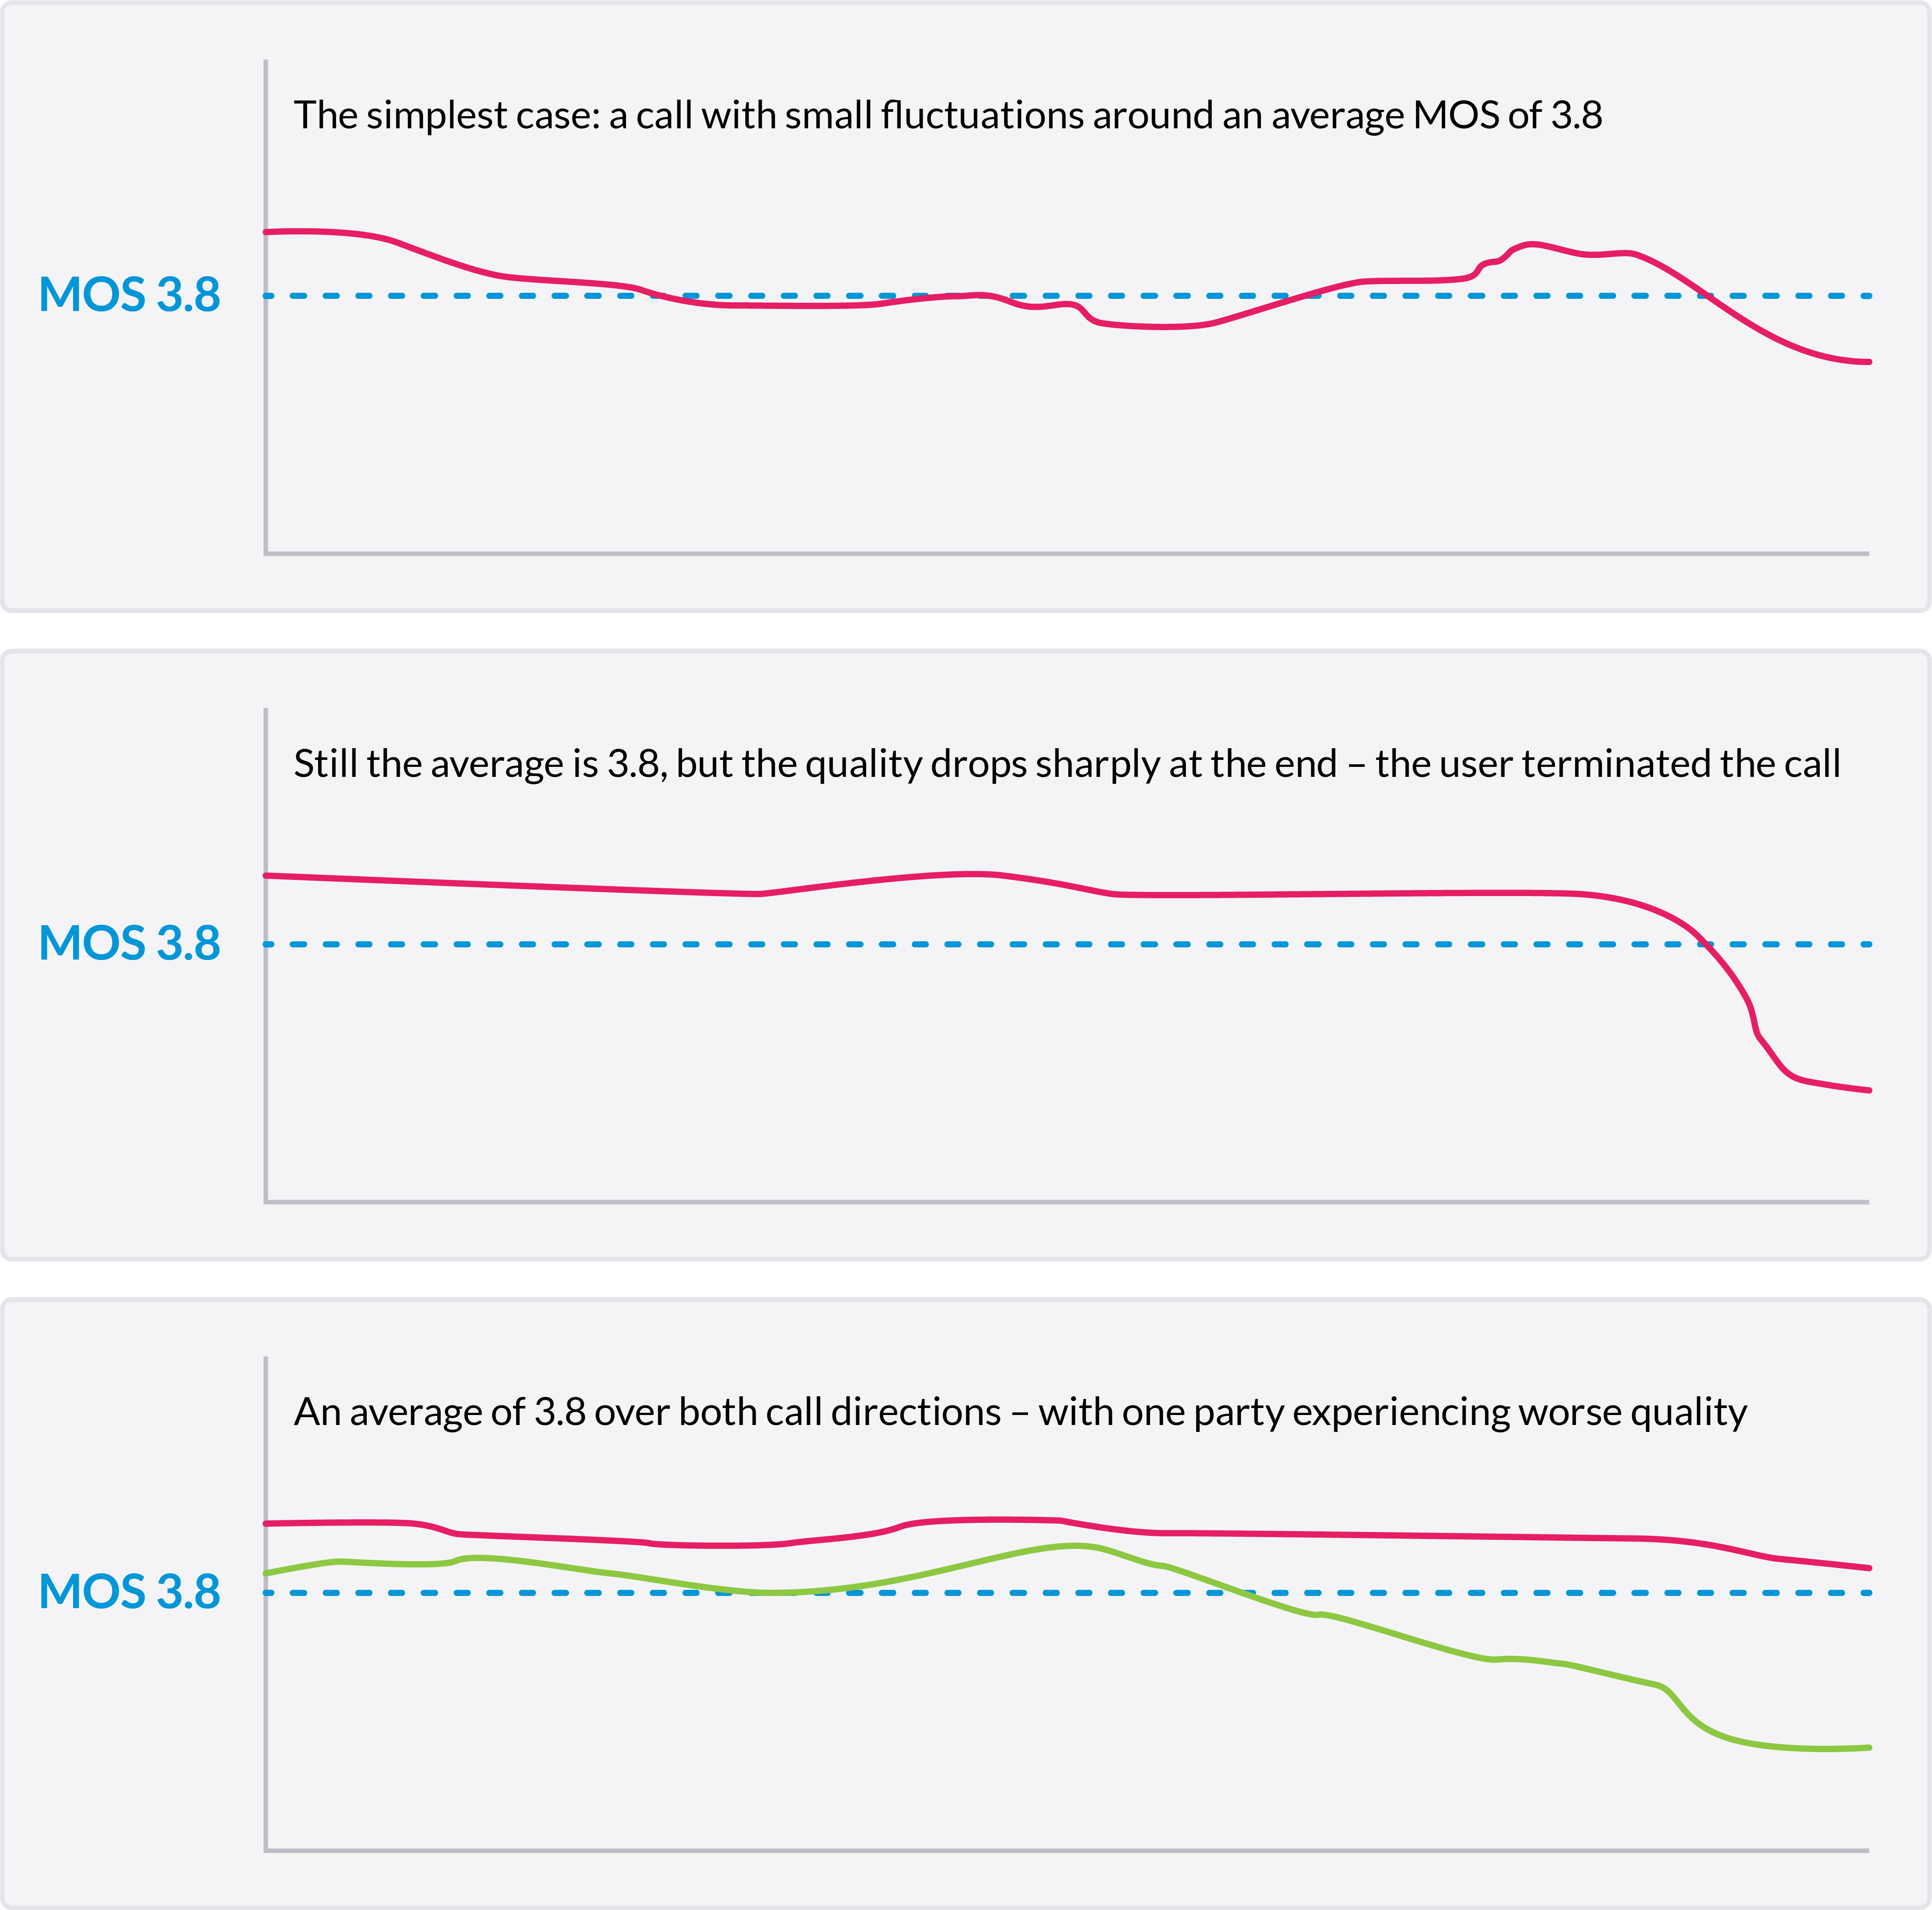
Each call returns a MOS value of 3.8. Not great, but not bad. A 3.8 value tells you that the call quality was good enough to hold a conversation.
In the first scenario, both users and service providers see small fluctuations around the average MOS of 3.8. However, with a single value, it is impossible to understand temporal information or how the call quality differs depending on direction.
Scenario 2 shows a sharp drop at the end of the call that likely caused the user to hang up. But given the decline in MOS value only occurred for a short period at the end of the call, the average remains high, masking the poor user experience.
Scenario 3 shows a situation where one party is experiencing significantly worse call quality than the other. Again, the average of the two users’ call quality fails to capture the unsatisfactory user experience for one of the parties.
One MOS value can end up telling very different stories.
So, what’s the solution? Given the fact that a single average is misleading, how do we adapt MOS to discover temporal information, allow for direct comparisons, and facilitate aggregation for advanced statistics?
Reflecting actual user experience with time-slicing
Time-slicing tracks MOS throughout the call rather than making an average, to provide a more meaningful measure of user experience. With time-slicing, each call is broken up into smaller chunks of equal length.
Determining call quality metrics for each slice provides temporal information. For example, a short but significant drop in MOS value does not become hidden by a strong average across the rest of the call. Plus, translating a call into a series of equal slices allows for the direct comparison of MOS values.
The sampling rate, or length of each time slice, determines the quality of information returned:
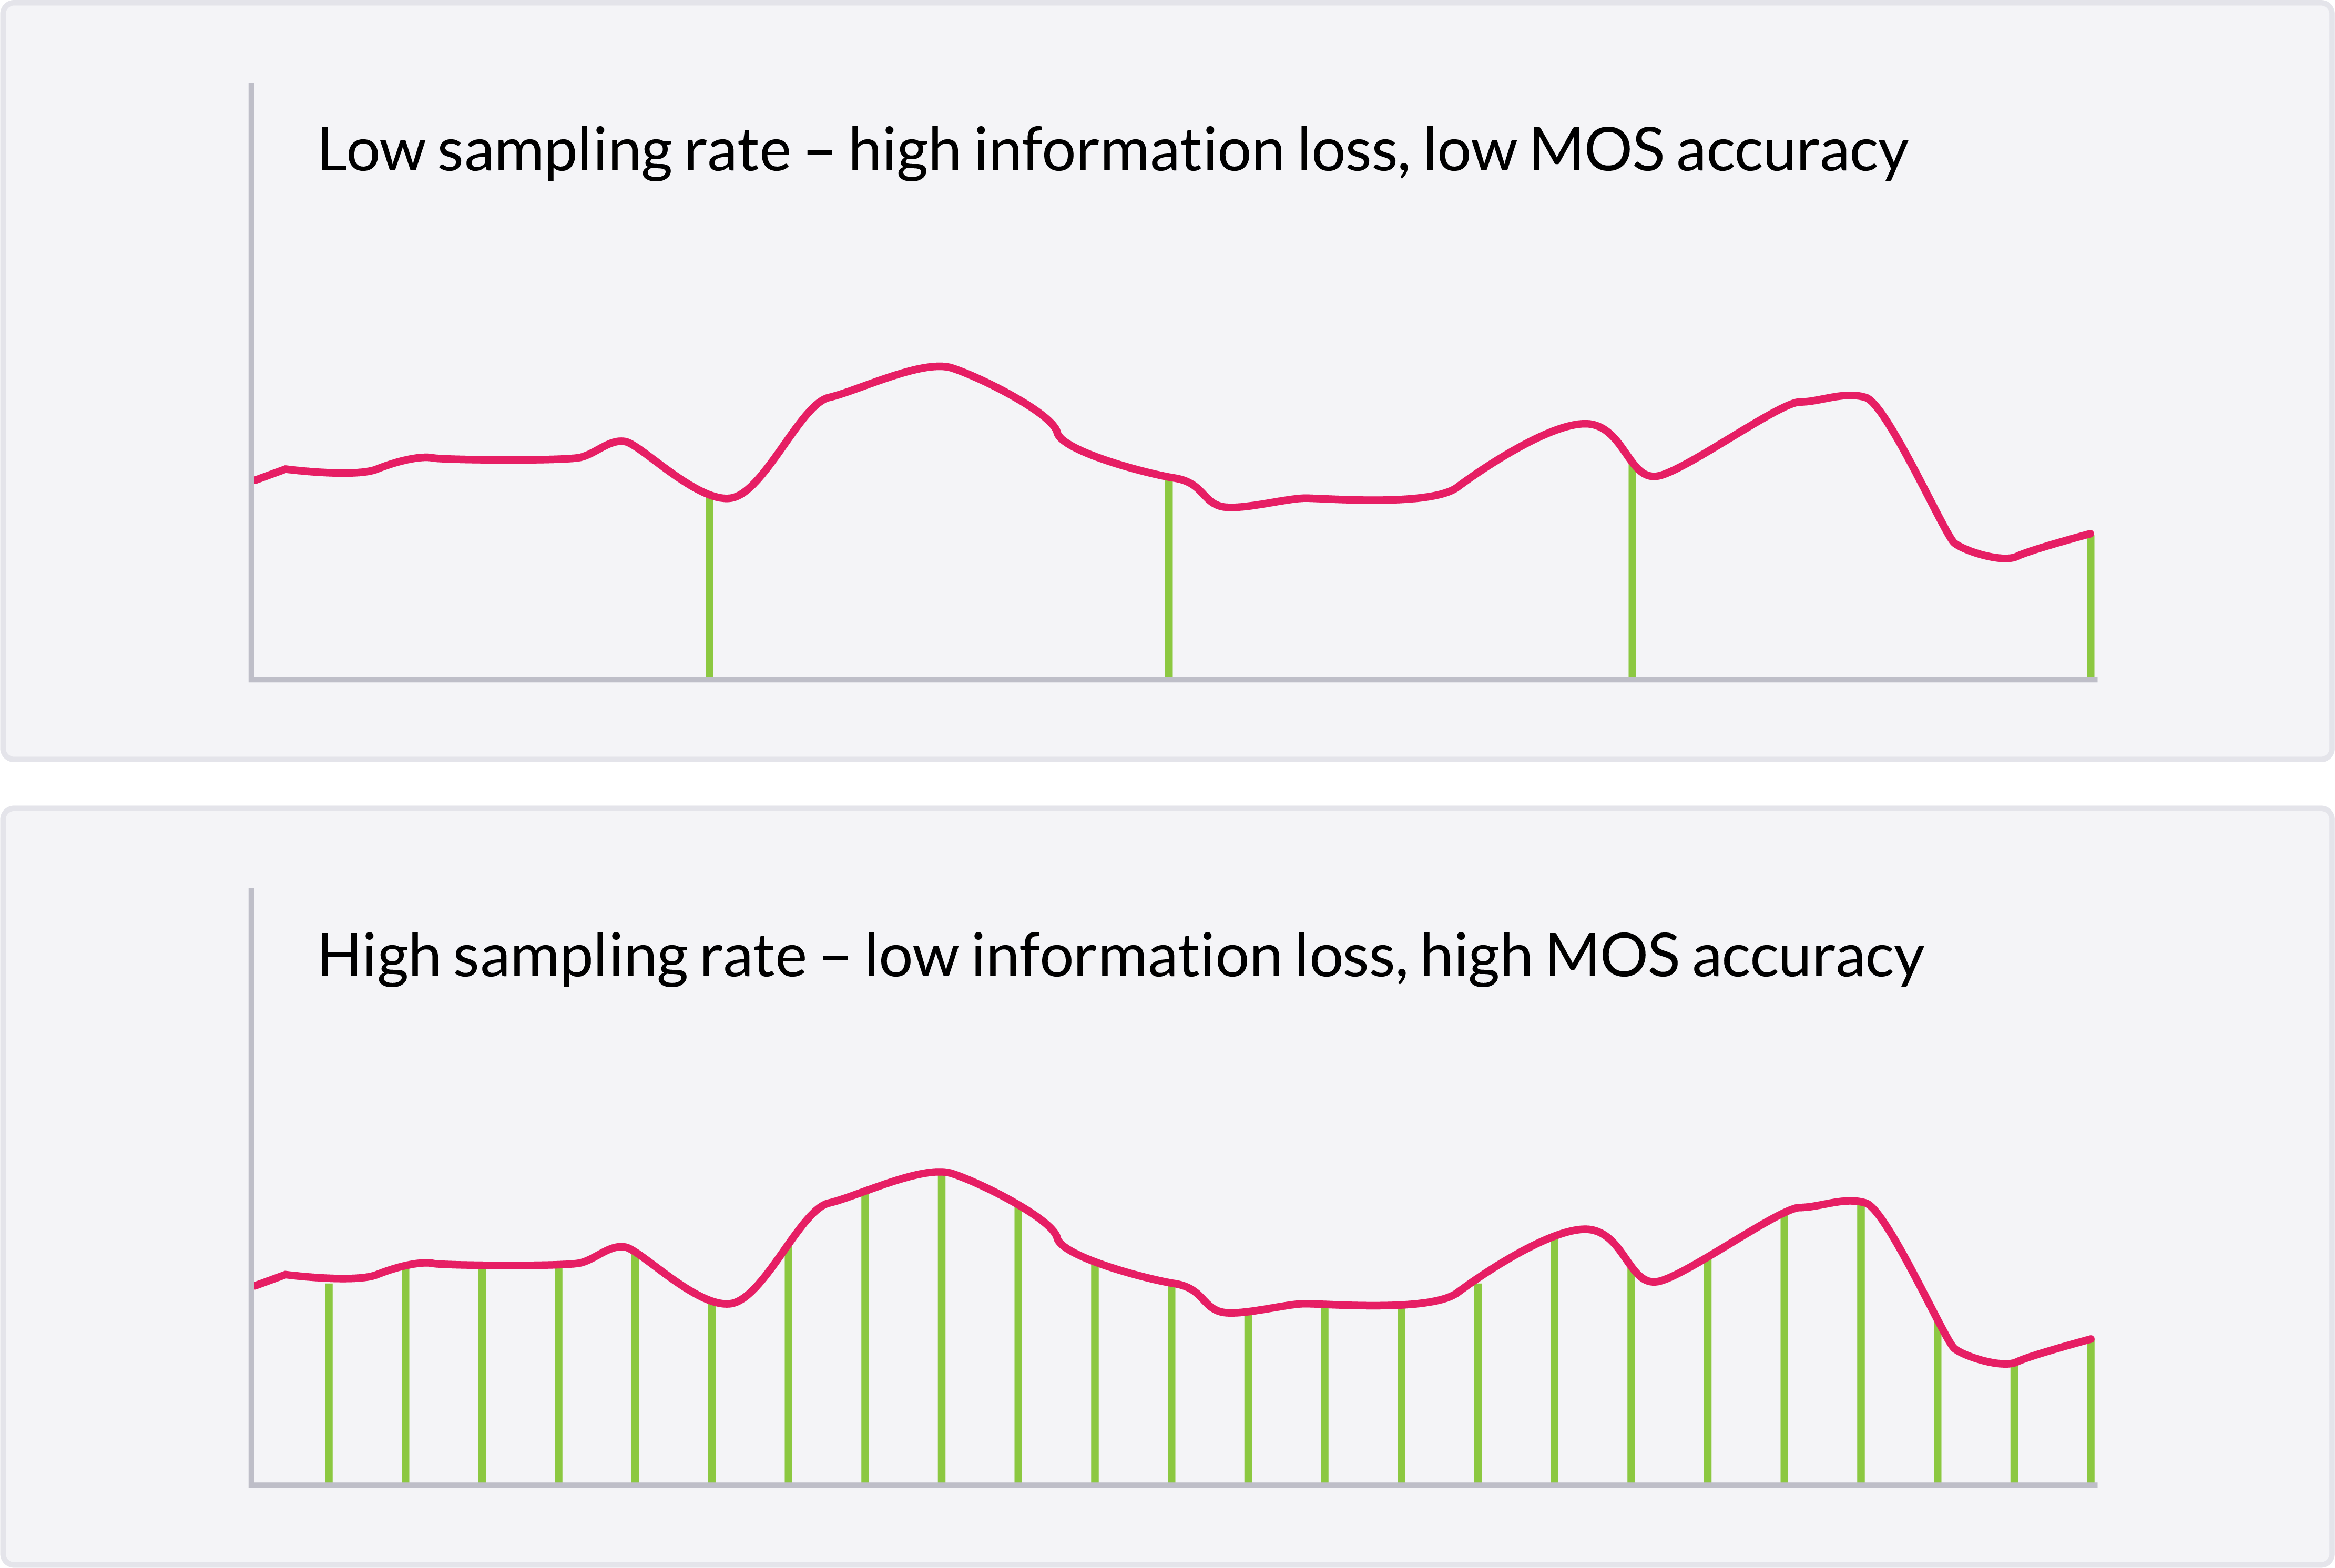
Voipfuture Qrystal is an example of a call quality monitoring solution that uses time slicing to sample MOS and other metrics every 5 seconds. The system passively tracks RTP (Real-time Transport Protocol) flows, using the Mode B method described in ITU-T recommendation P.564.
These measurements allow Qrystal to calculate the estimated listening quality MOS (MOS-LQE) and estimated conversational quality MOS (MOS-CQE) in order to provide a genuine reflection of the user experience. These estimates utilize the E-model defined in the aforementioned ITU-T G.107.
The E-model algorithm incorporates several factors that are connected to media transmission causing quality deterioration, particularly factors related to cumulative data loss. Parameters needed to accurately estimate both listening and conversational MOS values for each time slice include:
- The codec
- Burst loss information (i.e., consecutive packet loss, CPL)
- Critical loss density (CLD) (i.e., the number of packets received in between loss events)
- Individual packet interarrival times (PIT)
The E-model produces an R-factor, representing the overall call quality of each time slice. This R-factor can be used to estimate the MOS score. For more information on how this R-factor is determined, check out this white paper on “Mean Opinion Score (MOS)–Calculation and Aggregation.”
Qrystal stores the MOS values and other call-quality metrics for every 5-second time slice in a quality data record (QDR). This includes information regarding transport quality, policy conformance, and more. QDRs act as an accurate and detailed summary of the VoIP RTP stream.
Replacing averaged MOS data with time-sliced QDRs helps service providers identify problems, troubleshoot, and solve issues faster. As shown in the examples above, a single MOS value can sometimes hide severe call quality problems. In these instances, the service provider will only be made aware after a customer complaint.
With temporal information, they can quickly pinpoint issues as they arise and spot any time-correlated events in the media plane (i.e., time-sensitive patterns in call quality data). This reduces delays in solving network problems and leads to a better customer experience.
Plus, with fixed time slice data, service providers can simplify aggregation and improve analytics.

Aggregating call quality metrics for improved analysis
Aggregation is not possible using mixed-length Mean Opinion Scores, and this prevents providers from determining the quality of RTP streams, the network, or the entire VoIP service.
For example, with only the average MOS per call, you cannot directly compare or aggregate a 5-minute and a 1-minute call. Does a MOS value of 3.9 over 5 minutes reflect user experience in the same way a MOS value of 4.0 does for a 1-minute call? Which call had the better quality? Without a standard reference for comparison, it isn’t easy to say.
The fundamental benefit of time-slicing is having a database of short and uniform call quality metrics. These QDRs form the building blocks of more advanced analysis.
For example, when every MOS value represents a fixed time slice, the data can be combined to produce distributions of MOS-qualified call minutes or MOS minutes. This information is easy to visualize by plotting a histogram utilizing the five bins for quality defined in ITU-T G.107:
| Class | 1 | 2 | 3 | 4 | 5 |
| MOS | <3.10 | 3.10-3.60 | 3.60-4.03 | 4.03-4.34 | >4.34 |
| User experience | Almost all dissatisfied | Many dissatisfied | Some dissatisfied | Satisfied | Very satisfied |
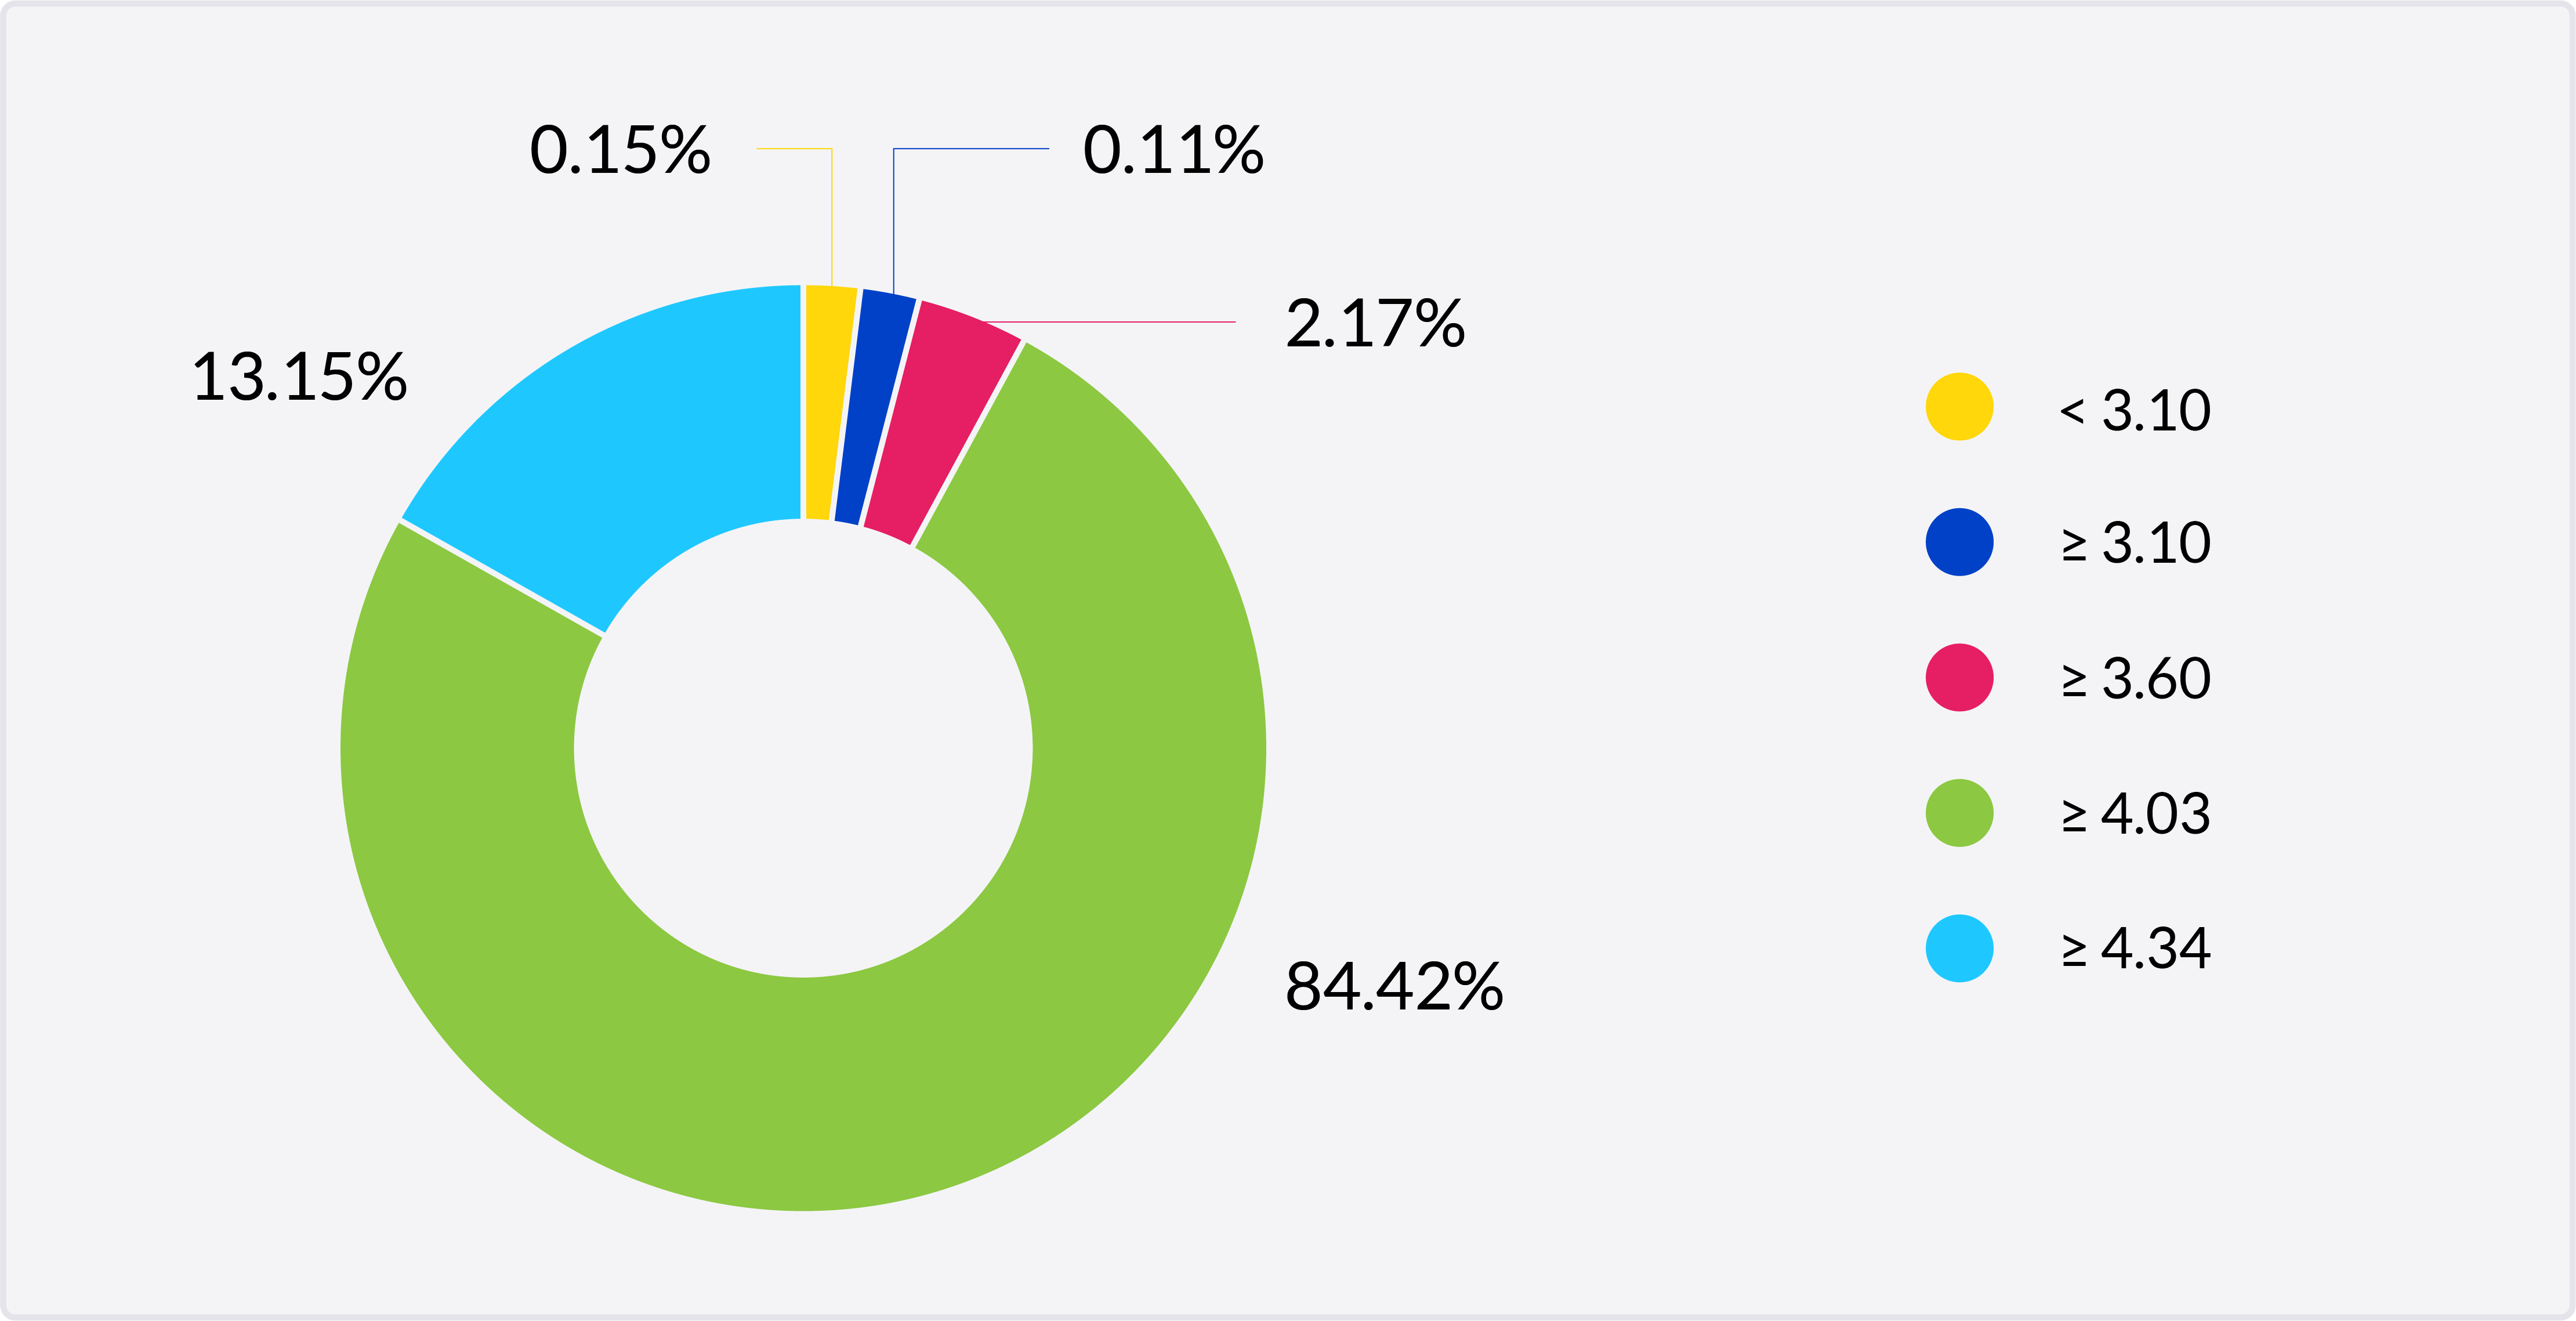
MOS minutes allow service providers to standardize their MOS data and better assess the overall user experience they are delivering.
These types of aggregation simplify the creation of meaningful statistics, metrics, and KPIs, such as:
- Good Stream – A stream of RTP packets with a MOS value above 4.03 producing a good user experience during the entire call
- Good Minute Ratio (GMR) – A ratio of the ‘good’ QDRs (5-second segment with MOS > 4.03) divided by the total number of all QDRs
To standardize approaches to time-slice-based analysis in VoIP, the European Telecommunications Standards Institute (ETSI) has developed the recommendation TR 103639, providing a framework for a whole set of timeslice metrics and KPIs.
Summary
Mean Opinion Score (MOS) is a helpful tool for assessing call quality and determining the end-user experience. However, when averaged over an entire call, the metric has severe limitations to the point where it can become outright misleading.
How long do you stay on a call once you can not hear what the other person is saying?
Poor call quality means users hang up; it doesn’t last long. Therefore, a simple average alone fails to capture its impact.
Sampling MOS across the entire call and accessing temporal call quality information removes this problem. Time-slicing dramatically increases the value of MOS data; It exposes previously unseen issues and allows for direct comparison and aggregation, to provide new analysis that improves user experience moving forward.
With time-slicing systems like Qrystal, MOS can only tell one very clear story. The dataset points to a single truth that reflects the experience of using the service.